How to Create a Gantt Chart with Milestones: A Step-by-Step Guide


The Gantt chart, developed by Henry Gantt in the early 1910s, has been a go-to project management tool for over a century—and for good reason. It’s one of the most powerful ways to visualize your project’s timeline.
Still building milestone plans in Microsoft Project? See our breakdown of the best Microsoft Project alternatives for teams that want milestones, dependencies and baselines without the complexity.
But here’s the real deal: Gantt charts – beyond simply mapping out tasks – excel at showcasing project milestones. These milestones act as vital checkpoints, giving you an instant snapshot of whether you’re ahead, behind, or right on track.
In this guide, you’ll learn how to leverage Gantt chart milestones to boost your project’s visibility, time management, and collaboration. From understanding the basics to adding milestones in tools like Excel and Teamhood, we’ll walk you through step-by-step to help you stay organized and on track. Let’s dive in.

What Is a Gantt Chart with Milestones?
A Gantt chart is a visual project planning tool that displays tasks over time. It typically takes the form of a horizontal bar chart, where each bar represents a task, and its position shows the start and end date. This layout helps you to track progress, allocate resources, and easily meet deadlines.
A milestone in a Gantt chart is a marker that highlights a key point or achievement in the project timeline. Unlike tasks, milestones don’t necessarily have a set duration but do represent the most important stages.
To visualize the tasks and project phases, the Gantt chart takes the form of a bar chart with two axes:
- The vertical axis lists all the tasks or phases
- The horizontal axis represents the project timeline
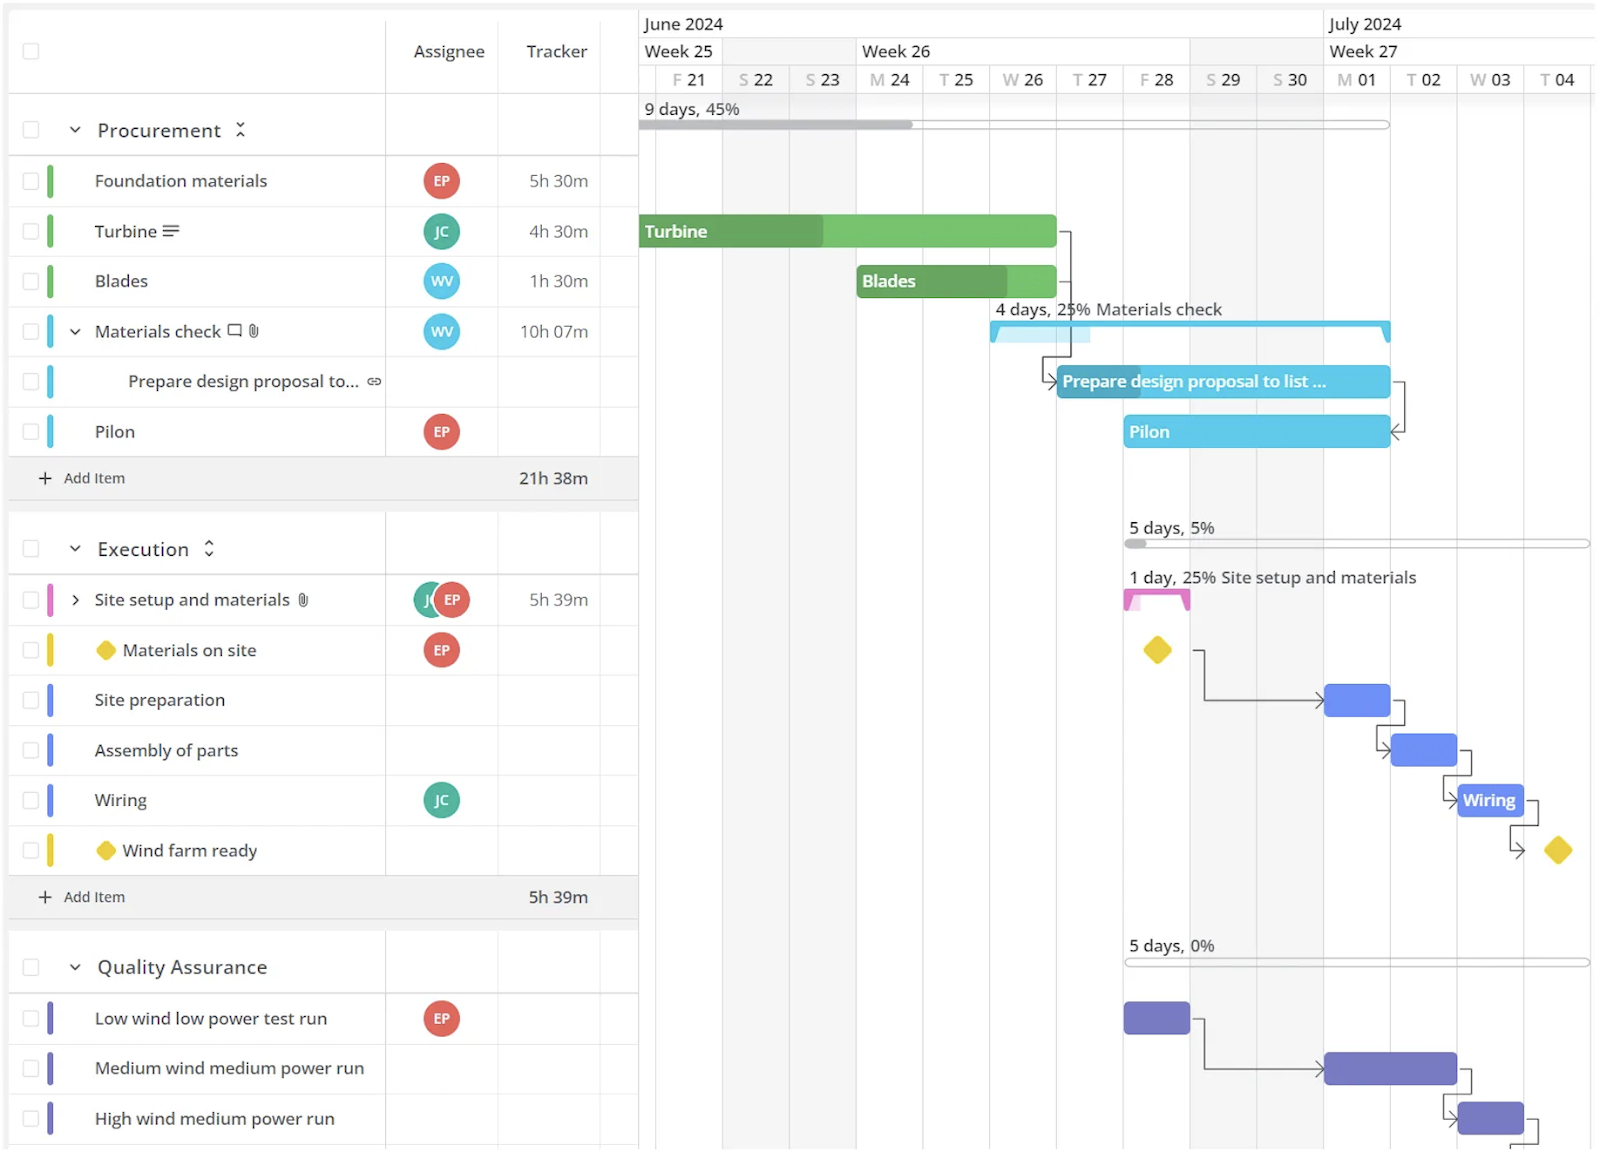
Milestones are typically shown as an easily spotted diamond shape. Breaking your project into smaller, trackable milestones makes it easier to see how things are progressing.
Aside from tracking progress, project leaders and team members use Gantt chart milestones as a guide to reveal potential issues or bottlenecks. This lets teams prepare ahead of time and make necessary adjustments.
Gantt Chart Milestones Benefits
More than half of employers provide time management training for their teams, and you should, too. The results pay off – solutions like Gantt charts boost productivity, especially now that many project management tools have gone online for easy collaboration.
Here’s why Gantt chart milestones are so useful:
- Improved visibility: Creates at-a-glance checkpoints throughout the project.
- Better time management: Tracks progress and stays on schedule. You’ll know if you’re ahead or falling behind before the deadlines approach.
- Enhanced collaboration: Serves as a shared goal for the team. Everyone stays aligned and pushes toward the same outcomes.
- Increased accountability: Sets clear goals for each member of the team, making it easier to hold the team accountable for meeting those targets.
You can check out our online Gantt chart maker to start planning your projects with ease.
How Gantt Chart Milestones Work: Project Examples Included
You essentially determine at what stage the milestones are based on your project’s needs. Here are examples of where Gantt chart milestones are essential:

- Website development project: When making a website, you can set a milestone for completing the design phase. Once approved by the client, the project can move forward with development. This milestone signifies a major step before coding begins.
- Marketing campaign launch: A milestone could also be finalizing the content for your promotional materials. This marks the point where all the creative assets are ready. At this stage, the team can distribute the materials across various channels for execution.
- Engineering management: When managing a complex project like infrastructure design, a senior engineer might use milestones to manage its key phases. A milestone could indicate when equipment procurement is complete, allowing the installation team to start work on time.
You’ll notice how a milestone introduces a task. But is a milestone a task? No, because tasks are the activities themselves that have set durations, while the milestones indicate completion.
While these are just a few examples, Gantt charts and project management go hand in hand, covering a range of tasks in various industries. These milestones are connected to task dependencies, where each task relies on the completion of others before progressing.
And together, these form a fully structured Gantt chart, providing a clear, step-by-step view of the project’s flow. Explore further examples of project milestones in the following post.
How to Add Milestones in a Gantt Chart: A Step-by-Step Guide
You can create Gantt chart milestones using different tools. In this case, we’re making them using the classic Excel and with a dedicated Agile project management software like Teamhood. Explore alternatives to Gantt chart.
How to Add Milestones in Excel
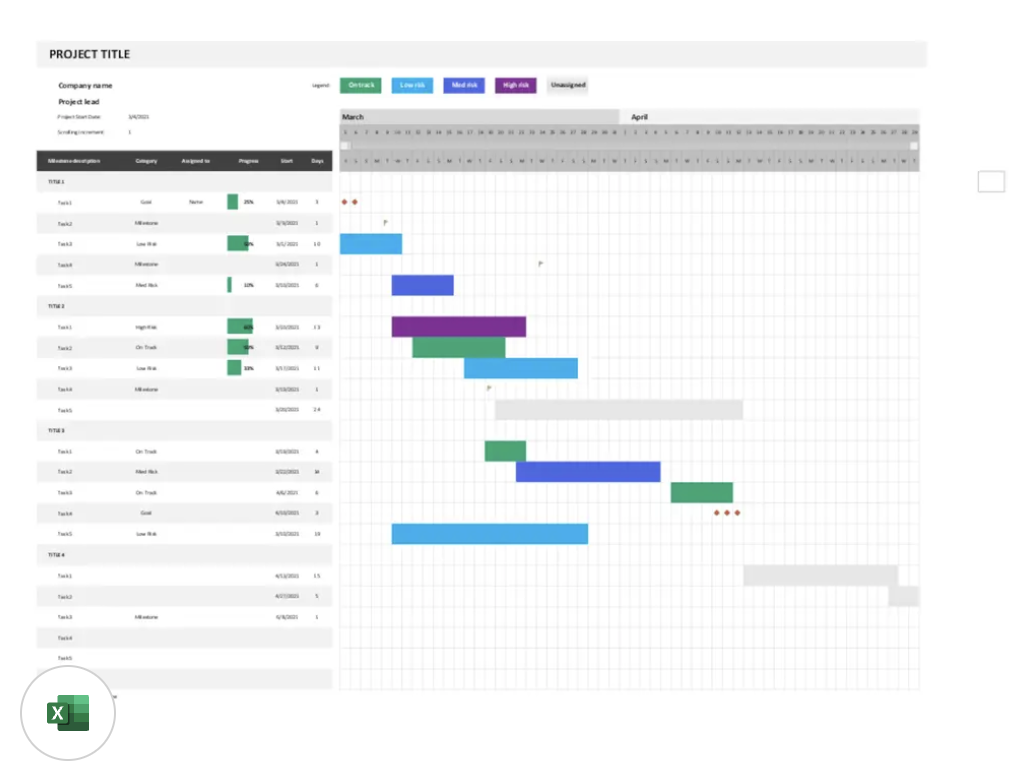
Creating a Gantt chart in Excel might take some effort. Keep in mind that Excel doesn’t come with its own built-in Gantt chart template. You’ll need to download one separately. Once you have it, you can start building your project plan. Here’s a quick rundown:
Step 1: Download a Gantt chart template. Find a reliable source online and download the template. We recommend the ones directly from Microsoft.
Step 2: Create a task list. Open the template and enter your project tasks in the designated area.
Step 3: Add table data. Fill in the start dates, durations, and any dependencies for each task.
Step 4: Format the Gantt chart. Change the chart’s appearance to match your schedule. Change the colors or adjust the bar lengths as needed.
Step 5: Identify dependencies. Determine which tasks will depend on others and add this information to the chart.
Step 6: Insert milestones. Highlight the milestones to indicate significant points in your project.
Note: While this method works for simple projects, it’s clear that it can be quite frustrating. Having to manage everything manually will take time, especially for larger projects. Still, Excel can be a handy tool if you just need a straightforward Gantt chart.

How to Add Milestones in Teamhood
What makes Teamhood unique is that it combines Kanban and Gantt chart functionalities. As a project manager, you might feel that these tools have to be used separately. Teamhood blends both, giving you a more comprehensive project management experience.
With Teamhood, you can switch views through its Kanban-Gantt chart. This allows you to get different perspectives on the same data. You can visualize tasks while keeping track of deadlines and dependencies to make decision-making much easier.

Because Gantt charts are already integrated into the platform, you can create the milestones you need in Teamhood right away:
Step 1: Create a new project. Start a new project or open an existing one.
Step 2: Add tasks. Enter your tasks on the project board.
Step 3: Switch to Gantt view. Navigate to the Gantt chart view to visualize your project timeline.
Step 4: Set milestones. Identify the significant points in your project and mark them as milestones in the Gantt chart.
Step 5: Monitor progress. Track task dependencies and progress through the Gantt view. Adjust as needed.
Teamhood supports both Waterfall and Agile methodologies. You can view your data in List, Kanban, or Gantt views. This allows each team member to choose their preferred way to work.
A real Gantt — dependencies, critical path and baselines
Turn your plan into a dependency-driven schedule with critical-path analysis and saved baselines — alongside deep Kanban, time tracking and project profitability, in one EU-hosted tool.
- Dependencies, critical path & baselines
- Kanban + Gantt on one board
- Time tracking & project profitability
- EU-hosted, with on-premise
Key Gantt Chart Milestones to Include in Your Projects
Remember that milestones are not tasks – they don’t have durations. Instead, they represent moments of importance or completion.
Project Approval Process
Milestone: Received project approval
Why it matters: Before the project can begin, the project charter, feasibility study, and stakeholder meeting must be completed. Reaching this milestone ensures the project has official authorization to start and move forward.

Project Budget Approval
Milestone: Received budget approval
Why it matters: Securing approval for the project budget is crucial. It ensures that the necessary resources are available and that the project is financially viable. Reaching this milestone ensures the project is properly funded for success.

Project Team Assembly
Milestone: Assembled the project team
Why it matters: A well-defined team is essential for project success. By selecting the right team members and ensuring they have the necessary skills and availability, this milestone ensures your project is staffed and ready to move into execution.
These are just a few examples. We’ve prepared a whole list of project milestone examples for you to try.
5 Best Gantt Chart Software with Milestone Features
Choosing the right project management software can make milestone tracking easier and more efficient. Here’s a quick comparison of top tools:
| Feature | Teamhood | Agantty | Bitrix24 | Celoxis | ClickUp |
|---|---|---|---|---|---|
| Free Plan | Yes | Yes | Yes | No | Yes |
| Business Pricing | From $9.50 | From $5 | From $39 | From $22.50 | From $5 |
| Dependencies | ✅ | ✅ | ✅ | ✅ | ✅ |
| Multiple Dependency Types | ✅ | — | ✅ | ✅ | ✅ |
| Milestones | ✅ | ✅ | ✅ | ✅ | ✅ |
| Baseline | ✅ | — | — | ✅ | ✅ |
| Custom Fields | ✅ | — | ✅ | ✅ | ✅ |
| Automatic Rescheduling | ✅ | ✅ | ✅ | ✅ | — |
| Sum of Field Values | ✅ | — | — | ✅ | — |
| Gantt and Kanban Integration | ✅ | — | ✅ | — | — |
| Tasks & Subtasks | ✅ | ✅ | ✅ | ✅ | ✅ |
Didn’t find the right match? Check out the full list of the best Gantt chart software.
Set Gantt Chart Milestones, the Modern Way
Time is ticking, and managing projects effectively is more critical than ever. Gantt chart milestones give you a clear path forward, and these help teams meet their deadlines efficiently.
As more companies embrace Agile methods and remote work, tools like Teamhood approach these time-tested project management tools in a more modern way. Using Teamhood’s Gantt chart software in your project management approach, you can truly transform your team’s work.
Give Teamhood a try today and see how it streamlines your projects to confidently reach your milestones!
Frequently asked questions
What's the difference between a goal and a milestone in a Gantt chart?
A goal is a broad objective that you want to achieve at the end of a project. Meanwhile, a milestone marks a specific point along the way that marks progress toward that goal.
How is a deliverable different from a milestone in a Gantt chart?
Compared to a milestone that serves as a checkpoint, a deliverable is the tangible output or product that must be completed during the project.
What's the difference between a task and a milestone?
As part of a project, the task represents a specific action that needs to be completed. The milestone is the significant point or achievement within the project timeline, often with no duration attached.